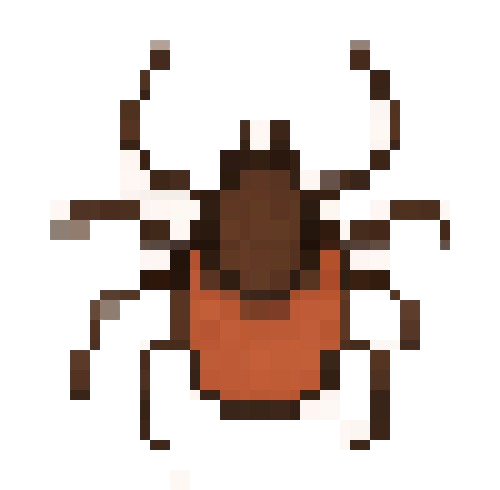
What are Deer Ticks?
Deer ticks are also known as black-legged ticks; they tiny arachnids that feed on blood.
These ticks are vectors for several serious diseases. Symptoms range from flu like to nuerological disorders.1
Lyme disease is caused by the bacterium Borrelia burgdorferi, through the bite of infected ticks. It often leads to flu like symptoms, rashes, and, if untreated, neurological and joint complications. Babesiosis, caused by Babesia microti, is a malaria-like parasitic infection that infects red blood cells. Anaplasmosis is caused by the bacterium Anaplasma phagocytophilum. Borrelia miyamotoi disease, caused by the spirochete Borrelia miyamotoi, is a more recently recognized illness that shares some symptoms with Lyme disease.
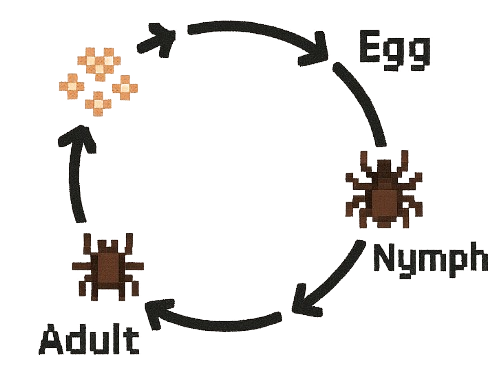
Tick Lifecycle and Seasonal Activity
Deer ticks have a two-year life cycle with four stages. They require a blood meal to progress between each stage.1
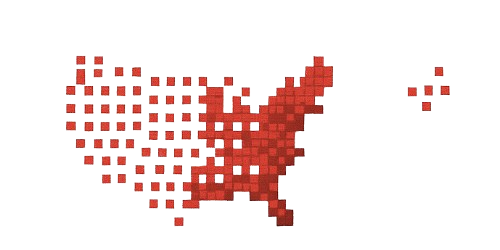
Tick Distribution in America
Deer ticks are found throughout America, but their distribution is not uniform.1
This visualization focuses on deer ticks in New York.
Recently , the state has reported widespread tick sightings through crowdsourced data.
Scientists predict that climate change is extending tick seasons2Explore the Data
The visualizations ahead will allow you to examine tick density and disease across New York counties over time.
You will also get the opportunity to explore correlations between tick related diseases and climate trends.
All data is crowdsourced data from the New York Gov Website.
1. mapping tick population and diseases
|
The spread and density of ticks are increasing
Sadly, this is old news. In fact, the Cornell Chronicle even reports new species of ticks are also expanding in the state.3
This begs the question,
What is causing these ticks to expand so quick?
2. correlating climate data and tick distribution
County:
Tick Property:
Our data does not show the strongest correlation between climate and tick property distribution
But is is known that they thrive in warmer, humid clmates, and therefore scientists continue keeping watch on these two parameters.4
One thing we may consider is plotting the data against other climate factors such as humidity, vegetation and greenhouse gas
Another thing we can invesigate is
Relationships between tick properties?
3. correlating tick properties (diseases and distribution)
Help Us Track Deer Ticks
Your participation can help scientists monitor tick populations and disease spread.
If you find a tick, consider sending a sample to these labs:
Thank you for contributing to public health research!
References
- New York State Open Data, “Deer tick surveillance data,” Available: https://data.ny.gov
- New York Flora Atlas, “Flora distribution data for New York State,” Available: https://newyork.plantatlas.usf.edu
- Mayo Clinic, “Tick species that carry diseases,” Available: mayoclinic.org
- Cornell University, “New invasive ticks expanding in New York State,” Available: news.cornell.edu
- Medical News Today, “What to know about deer ticks,” Available: medicalnewstoday.com
- A. Ducharme, “How climate change is expanding tick territories,” TIME Magazine, Mar. 2023, Available: time.com
- E. Roston, “What’s really warming the world,” Bloomberg Graphics, 2015, Available: bloomberg.com
- R. Goldenberg, “Scrollama.js,” GitHub, Available: github.com
- D3.js, “D3 documentation and examples,” Available: d3js.org
- Stack Overflow contributors, Stack Overflow, Available: stackoverflow.com